My year-long quest to debug a single TCP connection
A few years ago, at a former company, I found myself tangled in a recurring technical mystery that would last about a year. Along with my teammates, I was responsible for a critical data pipeline that started with a live feed of AIS messages from a satellite provider. This feed, sent over a redundant pair of TLS connections from servers in Canada, was the source of persistent reliability issues and a great deal of operational pain. This is the story of that troubleshooting saga, and how it led me to write go-tcpinfo.
The black box
The provider required that we connect to their feed using uniproxy, a specific C++ TLS-to-TCP proxy. I was given a tarred Docker image and a small configuration file and told to run it. I quickly found it had some annoying limitations: it could only handle one downstream client at a time, it didn’t log to stdout, and it exposed no metrics in a convenient format. To work around this, I wrote a simple Python proxy to sit behind it and fan the data out to our services.
During the provider’s first few monthly maintenance windows, I noticed our clients were getting disconnected and we were losing data for tens of minutes at a time. Their tech support didn’t have the means to tell us why. Expecting that instrumenting the connection at the OS level would be hard, I first looked into adding better logging to the uniproxy code itself.
Reading their code, however, I discovered that after a brief registration phase, the C++ application did nothing more than proxy bytes between the upstream TLS socket and a single downstream TCP socket. I figured I’d be better off just adding TLS support to my Python proxy and ditching uniproxy altogether. After a quick test with openssl s_client and a call with their engineers to ensure I wasn’t creating new risks, I put my custom client into production.
From “what” to “why”
Soon enough, the disconnections happened again, each time requiring a painful process of obtaining backfill data. My new logging, at least, showed what was happening: our TCP connections were being terminated from the server side with RST packets, and sometimes reconnection would fail for minutes because the server was unreachable.
Over the next few months, meetings and emails with the provider offered up two theories:
- We weren’t sinking data fast enough, causing their server to drop the connection.
- High latency and packet loss on the network path between our hosts in Sydney and theirs in Canada was the culprit.
To test these, I set up a VM in a US location for a low-RTT connection and ran experiments. The results were clear: the same disconnections and data loss occurred for all clients, regardless of location. This eliminated the high-RTT theory, but I still didn’t know the root cause.
The provider then revealed something new: during maintenance, they would buffer incoming messages and replay them afterwards, causing large bursts. This motivated me to build a tool that could plot the message rate and the lag between the satellite timestamp and when we received it. The resulting graphs were telling. The periods of slowness and increasing lag were always terminated by a disconnection:
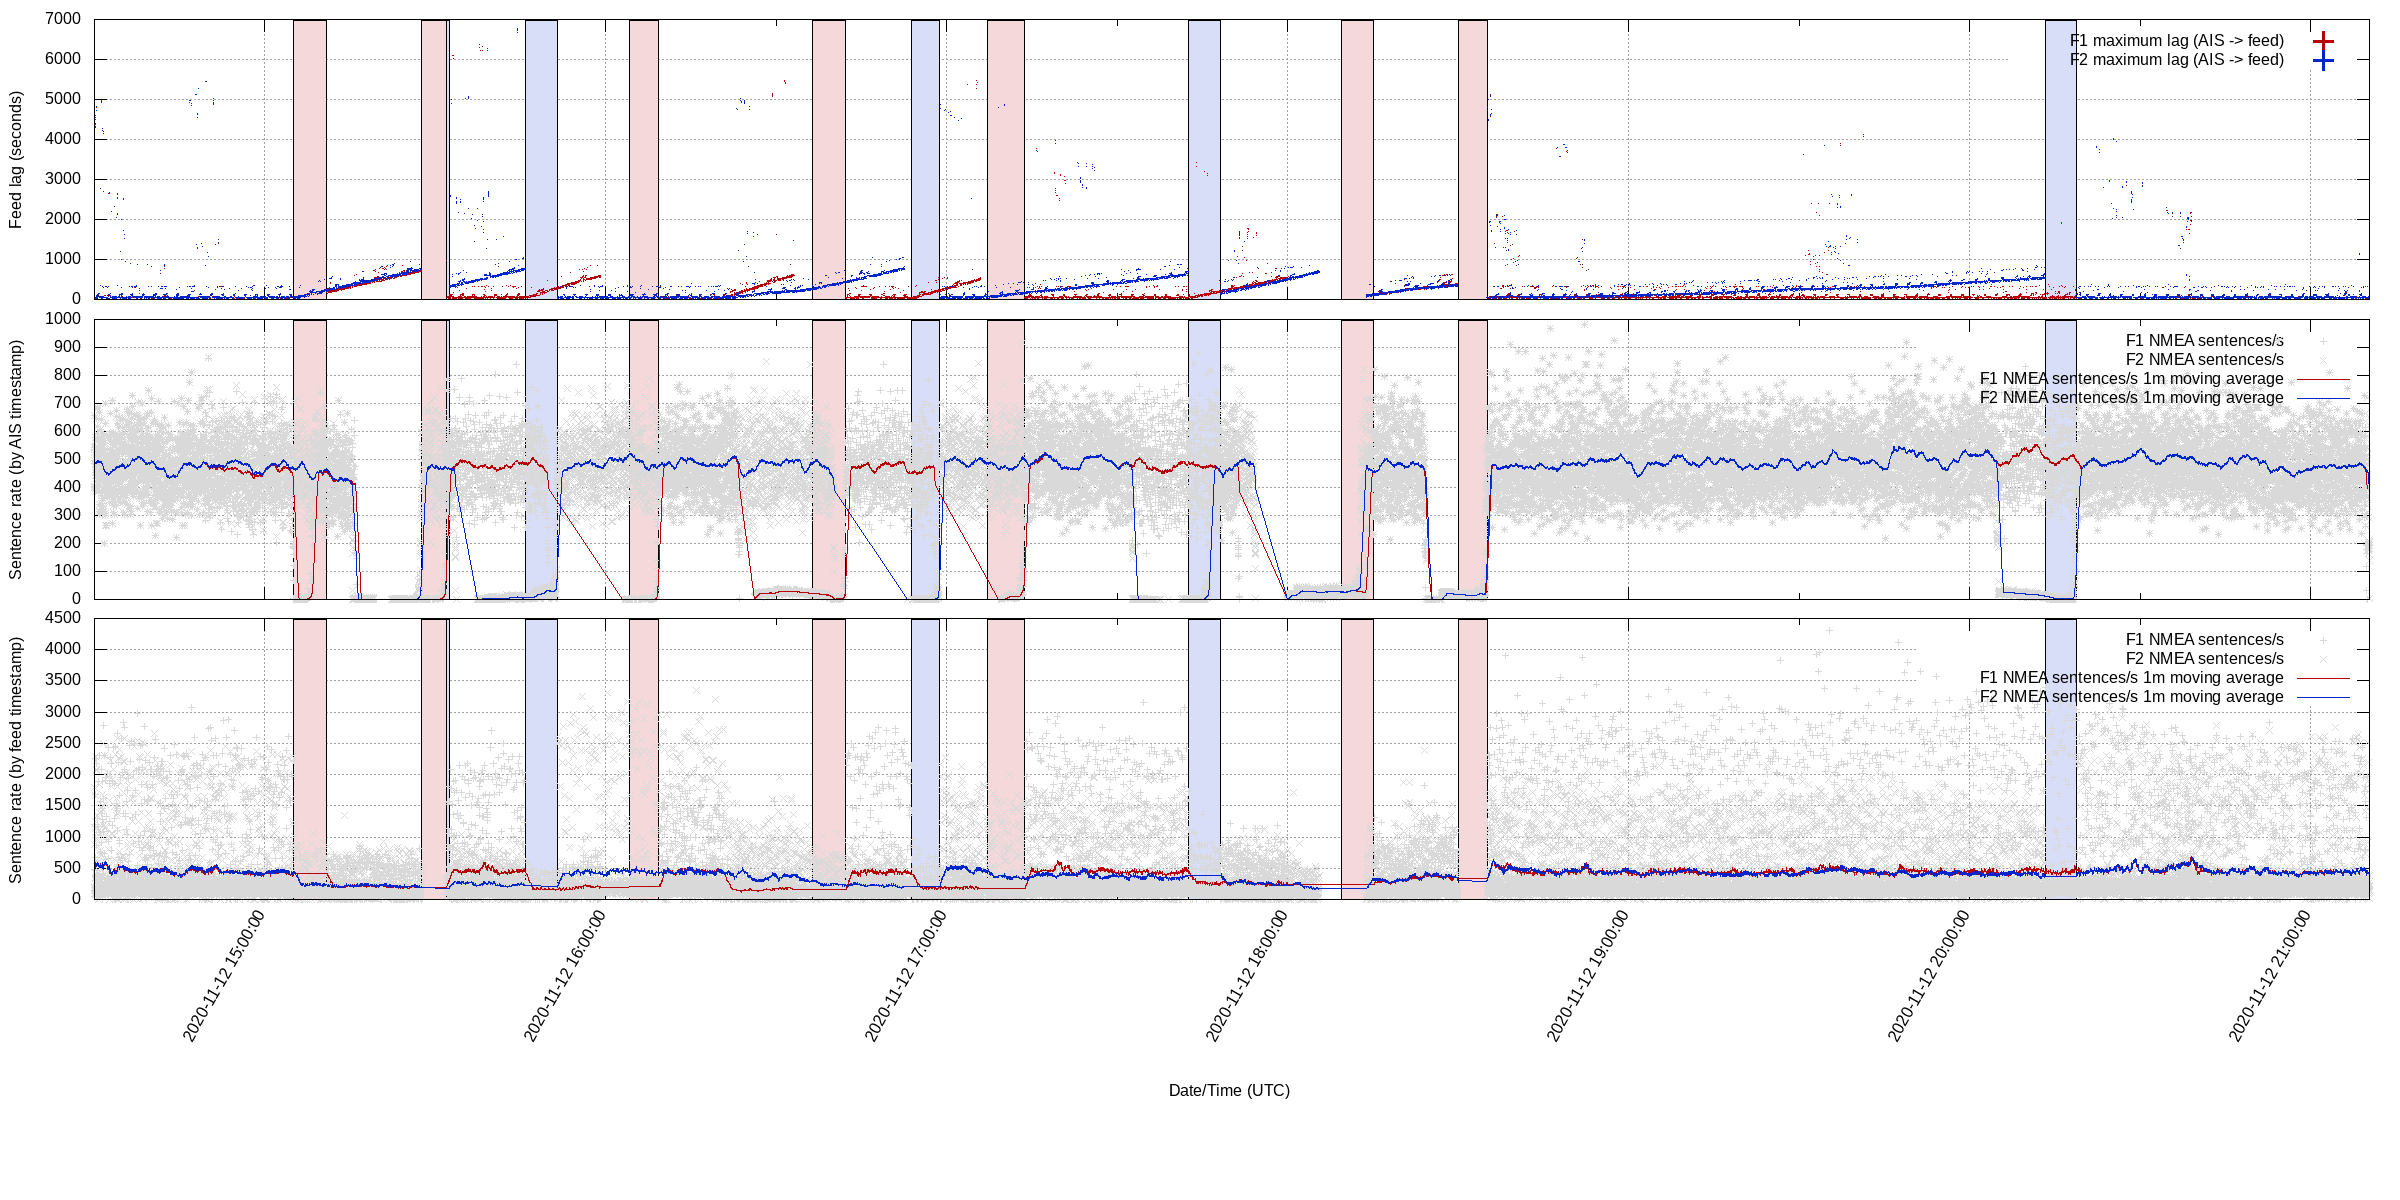
Real-time AIS feed lag and disconnections
I concluded this had to be because either the server or the client was not keeping up, but I still couldn’t argue it was one and not the other.
Kernel-level truth
Thinking about the problem from first principles, I reminded myself that a slow receiver would cause its TCP window to scale down, eventually telling the sender to stop sending. The only way to definitively prove whether we were the bottleneck was to get metrics from the kernel’s TCP_INFO struct for our upstream connection.
I decided to reimplement the custom proxy in Go, which I called multiproxy, and add a few key features: per-client queues to handle slow downstream consumers, and most importantly, the ability to record and export TCP_INFO metrics from the kernel. This would finally allow me to see the congestion window size and RTT, and determine if the connection was sender, receiver, or network-limited.
This is harder than it sounds. The TCP_INFO socket option is a powerful diagnostic tool, but its underlying data structure evolves with the Linux kernel. An application built for a modern kernel can fail to compile, crash, or silently miss data on an older system.
My initial implementation was simple and targeted the modern kernels we were running in production at the time. But the experience made me realise that a truly reusable, public version of the tool would need to solve this problem more robustly. This is the problem the public release of go-tcpinfo was built to solve. It uses a two-pronged approach:
- Completeness: It maps to the full
tcp_infostruct available in modern kernels. - Robustness: It detects the host’s kernel version at runtime and intelligently populates only the fields that are genuinely supported. This guarantees that a single, statically-compiled binary works correctly across a wide range of Linux systems.
A key feature is its safe and unambiguous API. When a field isn’t supported by the kernel, it isn’t left as a zero-value, which could be ambiguous. Instead, go-tcpinfo uses nullable types that explicitly mark if the Value is Valid, allowing you to reliably distinguish between a metric that is truly zero and one that is unavailable.
Here is a quick usage demo takend from the README file:
package main

import (
	"fmt"
	"github.com/higebu/netfd"
	"github.com/simeonmiteff/go-tcpinfo/pkg/linux"
	"net"
)

func main() {
	conn, err := net.Dial("tcp", "google.com:80")
	if err != nil {
		panic(err)
	}
	defer conn.Close()

	fd := netfd.GetFdFromConn(conn)
	if err != nil {
		panic(err)
	}

	tcpInfo, err := linux.GetTCPInfo(fd)
	if err != nil {
		panic(err)
	}

	fmt.Printf("RTT: %d, RTTVar: %d\n", tcpInfo.RTT, tcpInfo.RTTVar)

	if tcpInfo.MinRTT.Valid {
		fmt.Printf("MinRTT: %d\n", tcpInfo.MinRTT.Value)
	}
}
Example output:
RTT: 20928, RTTVar: 10464
MinRTT: 20928s
A prometheus metrics exporter is also provided by `go-tcpinfo’. You can grab a copy of the code here: https://github.com/simeonmiteff/go-tcpinfo
Resolution
Just as I was about to use my clever new capability, we received a message from the provider: “the vendor” had fixed a bug and the disconnection issues should be solved. And they were. At the next maintenance window, there were no disconnections, and for the first time, we saw the massive replay spike of buffered messages. My new multiproxy client and our pipeline kept up perfectly.
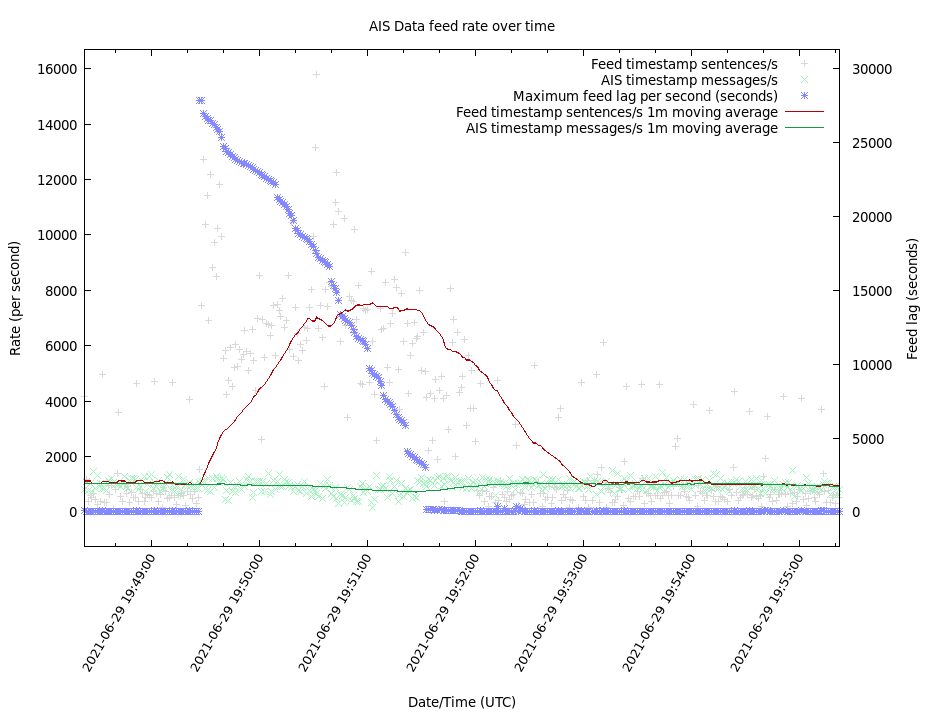
AIS feed with working replay of dropped messages during a maintenance window
It’s a shame I didn’t get to use go-tcpinfo in anger to deliver the final smoking gun, but I’m glad I implemented multiproxy anyway. This “system misbehaviour” occurred over a period of more than a year. While I can’t be certain, I speculate that the detailed feedback my investigation provided is what enabled them to get their vendor to find and fix the bug. It required patience and persistence, but the experience was a powerful lesson in the necessity of deep, full-stack observability. go-tcpinfo is the tool I wish I had on day one.